
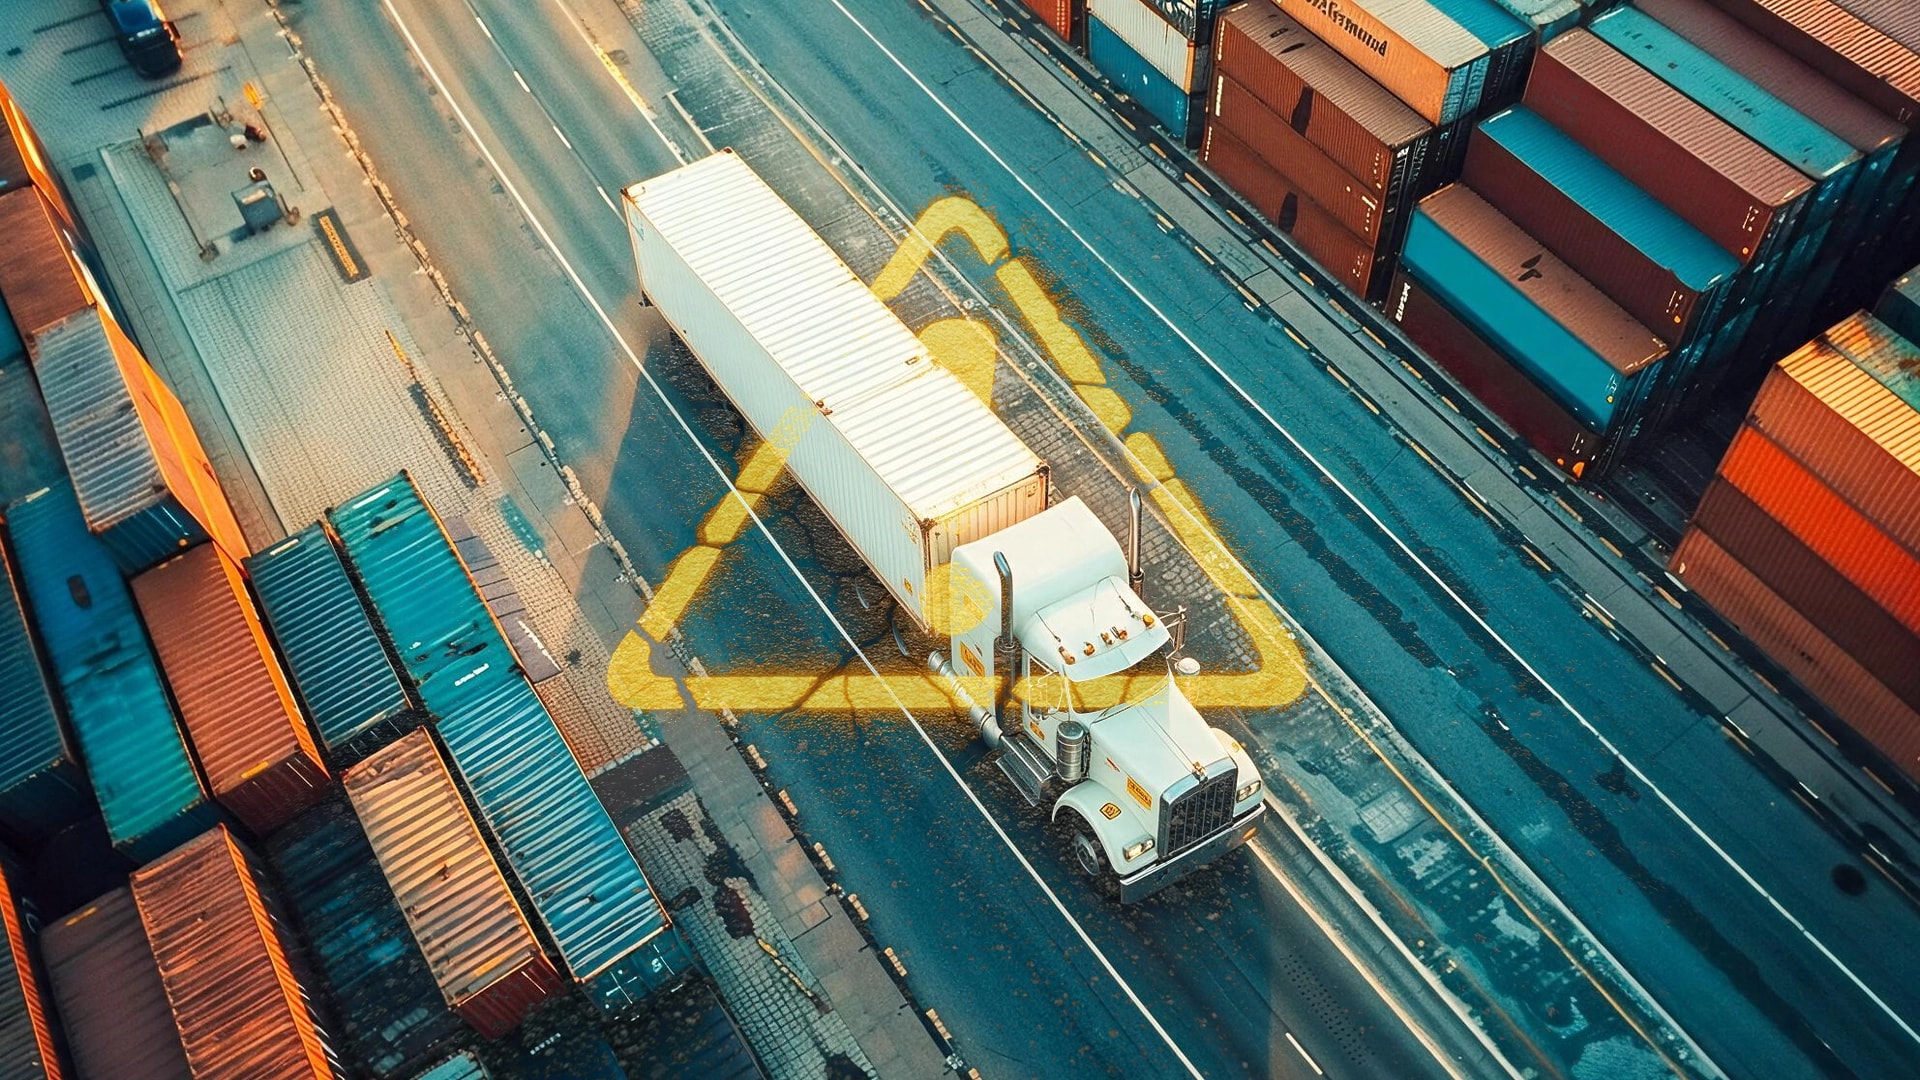
Your terminal does not hit capacity overnight.
It happens gradually.
By the time trucks are backed up at the gate, the warning signs already showed up somewhere else:
In your dock schedule
In your detention invoices
In how often dispatch calls a driver to say "just wait"
Whether you are a carrier, a broker, or a 3PL managing someone else's dock, congestion is expensive. It slows drivers down, it racks up detention fees, and it makes your whole network less reliable.
So here are 7 signs that tell you capacity trouble is coming, before it shows up as a truck queue at the gate.
The 7 Signs Your Freight Terminal Is Approaching Capacity
1. Trailer turnaround time runs past 30 minutes
Turnaround time is simple. It is the time from when a trailer enters your gate to when it leaves. Efficient yards keep this under 30 minutes. Once you are consistently over 45 to 60 minutes, that is a signal worth investigating.
Therefore, this is usually the first number to check. If turnaround time is climbing week over week, something in your yard is already slowing down. It could be:
Door assignment delays
Paperwork bottlenecks
A driver waiting on someone to find the right trailer
Real-time tracking is what makes this number visible as it happens, instead of something you calculate after the fact from a gate log.
2. Dock door utilization crosses 85%
Door utilization measures how much of your available dock time is actually being used for loading and unloading. Under 60% usually means a scheduling problem, not a capacity problem. However, once utilization climbs past 85%, you are genuinely running out of room. There is no more slack to absorb a late truck or a rush order.
This number matters because it tells you whether the fix is scheduling or infrastructure:
Low utilization with long waits → your appointment system needs work
High utilization with long waits → you need more doors, more hours, or fewer appointments per slot
3. Yard staging climbs past 85% occupancy
Your yard is not just a parking lot. It is a buffer. Trailers wait there for a door, a driver, or the next leg of a move. When staging occupancy stays under 70 to 85%, you have room to absorb a bad day. Once you are consistently above that, one delay anywhere in the yard creates a domino effect everywhere else.
This is the metric that turns into a visible truck line at the gate if nobody catches it early. For carriers and brokers running freight across multiple regions, this is exactly the kind of regional capacity signal that needs to be visible at the zone or terminal level, not just for one yard at a time.
4. Detention is happening on far more than 1 in 10 stops
Here is where the trend really stands out. Back in 2014, FMCSA's baseline study found that drivers were detained beyond the standard two-hour window on about 10% of stops. By 2023, the American Transportation Research Institute found that number had climbed to 39.3% of all stops. That is roughly four times higher than the 2014 baseline.
If your own detention rate is tracking anywhere close to that, your terminal is likely past the point where "occasional delays" is an honest description.
According to a 2018 DOT Office of Inspector General audit, every 15-minute increase in average dwell time raises crash risk by about 6.2%. Longer waits do not just cost money. They cost safety.
5. Reefer and cold chain freight gets hit first
If you run refrigerated freight, watch this signal closely. ATRI's research found refrigerated trailer drivers were detained at a 56.2% rate, well above the 39.3% average across all freight types. Fleets running in the spot market saw detention on 42.5% of stops.
Therefore, if your terminal handles a mix of dry van and reefer freight, cold chain loads are usually your earliest indicator. Temperature-controlled freight has less flexibility to wait, which means congestion shows up there before it shows up anywhere else on your dock.
Driver Detention · By the Numbers
Detention has gotten a lot worse, not better
What used to be an occasional delay is now the norm at almost 4 in 10 stops.
Share of stops with detention beyond 2 hours
Roughly 4× higher than the 2014 baseline, and reefer freight runs even hotter than the average.
Crash risk per 15-min dwell increase
6.2%
U.S. DOT Office of Inspector General, 2018 audit
Detention invoices that get paid
<50%
Despite 94.5% of fleets charging the fee (ATRI)
Annual industry cost
$15.1B
$3.6B in direct losses, $11.5B in lost productivity (ATRI)
Sources: ATRI (2023), FMCSA (2014), U.S. DOT Office of Inspector General (2018)
6. Dispatch quietly drops appointments for first-come, first-served
When a facility gets busy, the appointment system is often the first thing to slip. Dispatchers start waving trucks in based on who showed up, not who was scheduled. It feels faster in the moment.
However, a U.S. Department of Transportation study found that manual, ad hoc scheduling processes increase truck wait times by 20 to 30% compared to structured appointment systems.
If your team has started skipping the schedule "just for today" more than once this month, that is not a one-off. It is usually a sign the yard is already past what the appointment system can handle cleanly.
7. Detention invoices pile up faster than they get resolved
This last one is a lagging indicator, but it is a reliable one. ATRI found that 94.5% of fleets charge detention fees, yet fewer than half of those invoices actually get paid. Across the industry, that gap adds up to $3.6 billion in direct losses and $11.5 billion in lost productivity every year.
If your detention paperwork is stacking up and taking longer to resolve than it used to, that is not just a billing problem. It usually means more trucks are getting stuck at your dock than your team has bandwidth to track, let alone invoice properly.
7 early warning signs your freight terminal is approaching capacity
Sourced from ATRI, FMCSA, and DOT research. Track these before the queue backs up to the gate.
Trailer turnaround runs past 30 minutes
Healthy: under 30 minDock door utilization crosses 85%
Capacity-constrained: >85%Yard staging climbs past 85% occupancy
Safe buffer: 70–85%Detention hits far more than 1 in 10 stops
Industry avg: 39.3% of stopsReefer and cold chain freight gets hit first
Reefer detention: 56.2%Dispatch quietly drops appointments for first-come, first-served
Manual scheduling: +20–30% wait timeDetention invoices pile up faster than they get resolved
Under 50% of invoices get paidSources: ATRI, FMCSA, U.S. DOT OIG, C3 Solutions, Qpasa
What to do once you spot these signs
None of these signs mean panic. They mean it is time to look closer.
01
Pull your turnaround and dwell time numbers for the last 30 days and check the trend, not just the average.
02
Separate detention data by freight type. If reefer loads are detained more than dry van, that tells you where to focus first.
03
Check how often dispatch is bypassing the appointment schedule. If it is more than once or twice a week, the schedule itself may need rebuilding, not just enforcing.
04
Track how long detention invoices sit unresolved. A growing backlog usually means the underlying congestion is growing too.
Why LoadStop catches this earlier than a spreadsheet or a phone call
Here is the actual problem with most terminals. The data behind these 7 signs already exists. It is just scattered:
Turnaround time lives in the gate log
Door utilization lives in the dock schedule
Detention invoices live in accounting
Dispatch escalations live in someone's memory
By the time anyone connects those four things into one picture, the queue is already at the gate. That is the gap LoadStop closes, and it is why the fix is not "check your spreadsheet more often."
"These 7 signs aren't independent. A missed appointment (sign 6) drives up dwell time (sign 1), which drives up detention (signs 4 and 5), which drives up unresolved invoices (sign 7). When they're in one platform, the second sign shows up while the first one is still small enough to fix."
How LoadStop maps to each sign
Real-time load tracking (Track and Dispatch) puts trailer location and driver status in one live view, so turnaround time (sign 1) is visible as it happens, not calculated after the fact.
FleetOps Planner shows capacity by zone and terminal, the exact view needed to catch sign 3 (yard staging climbing) before it becomes sign 6 (dispatch quietly dropping appointments to cope).
Trailer Pool adds the drop-trailer and pooling visibility that reefer and cold chain operations need most, since sign 5 shows temperature-controlled freight is usually where congestion shows up first.
The reason this matters more than a single dashboard: these 7 signs aren't independent. A missed appointment (sign 6) drives up dwell time (sign 1), which drives up detention (signs 4 and 5), which drives up unresolved invoices (sign 7). When each of those lives in a different system, nobody sees the chain until it is a truck line. When they're in one AI-First TMS, the second sign shows up while the first one is still small enough to fix.
See Terminal Capacity Signals Before the Queue Hits the Gate
LoadStop connects turnaround, yard staging, detention, and billing in one AI-First TMS so your team acts on sign 2 while sign 1 is still small.
Schedule a Demo